
Agent Pear Statistics
Users of the Pear Protocol front-end will see a collapsible "Agent Pear" section that houses some advanced statistics.
You do not need to understand these terms to be a profitable pair trader. Most users will not need to reference these values, but we include them for users who may find them a helpful reference point.
Here is a detailed definition of each term.
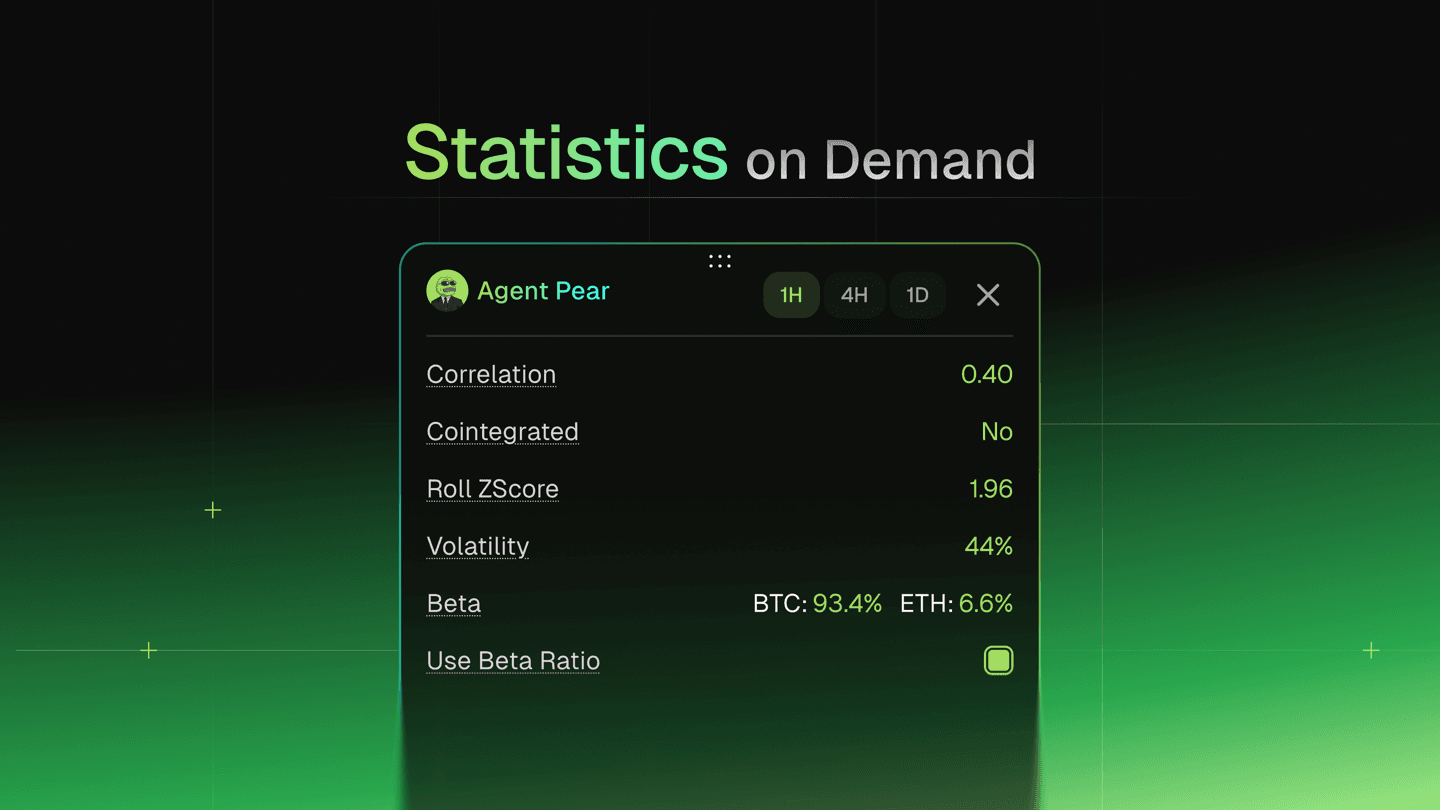
1. Correlation
Correlation measures the strength and direction of the relationship between the log returns of the two assets (shown per 1H / 4H / 1D window). We use Pearson's correlation coefficient, which ranges from -1 to +1.
- +1 → perfect positive correlation (assets move together).
- -1 → perfect negative correlation (assets move in opposite directions).
- 0 → no linear relationship.
Correlation helps you analyze if the pairs selected have a directional relationship and the magnitude of that relationship.
2. Cointegration
While correlation captures short-term co-movements, cointegration tests for a long-term, mean-reverting relationship between two asset prices.
- Assets may be highly correlated but still drift apart (non-stationary spread).
- Cointegration ensures that, despite short-term deviations, the spread between the assets tends to revert to a stable mean.
This property underpins the profitability of statistical arbitrage: if the spread diverges, it has a statistical tendency to revert. Again, cointegration is not necessary for most pair traders unless you are doing statistical arbitrage.
3. Rolling Z-score
The rolling Z-score measures how far the current spread is from its rolling mean, in units of standard deviations:
Z = (Spread − Mean(Spread)) / StdDev(Spread)
- High positive Z-score → spread is wider than usual (potentially short this pair).
- Low negative Z-score → spread is tighter than usual (potentially long this pair).
- Z-score near 0 → spread is at equilibrium.
Traders typically use thresholds (e.g., enter at ±2, exit at 0) to systematize when to enter and exit mean-reverting pair trades.
4. Beta
In trading, beta (β) measures how much one asset moves relative to another. Pear tracks two related measures: the long-term beta, which determines how to size the long and short legs of a trade (the hedge ratio), and the dynamic hedge ratio, which feeds the rolling z-score and monitoring. The sizing example below uses the long-term beta to build a beta-neutral position.
- Example: if Asset A has a beta of 1.26 versus Asset B, this means that for every 1% move in B, Asset A tends to move 1.26%.
Practical example: constructing a long A / short B pair with $100,000 capital:
1.26 × Long A = Short B
Long A ≈ $44,248 · Short B ≈ $55,752
This weighting ensures the portfolio is beta-neutral, so PnL is driven primarily by the convergence of the spread rather than market direction. In an ideal scenario, a trader rebalances their trades as the beta evolves over time.
5. Volatility
Volatility measures the standard deviation of log returns for the pair. It reflects the typical magnitude of price swings in the spread, reported annualized with a regime label (LOW / NORMAL / HIGH).
σ = √( Σ (rᵢ − r̄)² / (N−1) )
where rᵢ are the log returns of the spread and r̄ is their mean.
- Higher volatility → larger and more frequent price swings (more opportunity, more risk)
- Lower volatility → smaller price fluctuations (steadier spreads, fewer signals)
Volatility helps traders calibrate position sizing and risk management for each pair.
Together:
- Correlation → validates short-term co-movement.
- Cointegration → confirms long-term mean reversion.
- Rolling Z-score → provides entry/exit signals.
- Beta → ensures correct hedge sizing and risk balance.
- Volatility → quantifies the riskiness of the spread and informs overall position sizing.