
Agent Pear Signals
Agent Pear Signals algorithmic pair-trade ideas from Pear's quant engine
Agent Pear Signals are algorithmic pair-trade ideas generated by Pear's quant engine, not by the AI assistant. Every signal is the output of a statistical screen: it identifies a pair whose spread has stretched away from its historical mean and is expected to revert. The AI assistant reads, explains, and delivers those signals; it does not invent them.
Signals are not based on news, narratives, fundamentals, sentiment, or price prediction. They are pure mean-reversion statistics on price history.
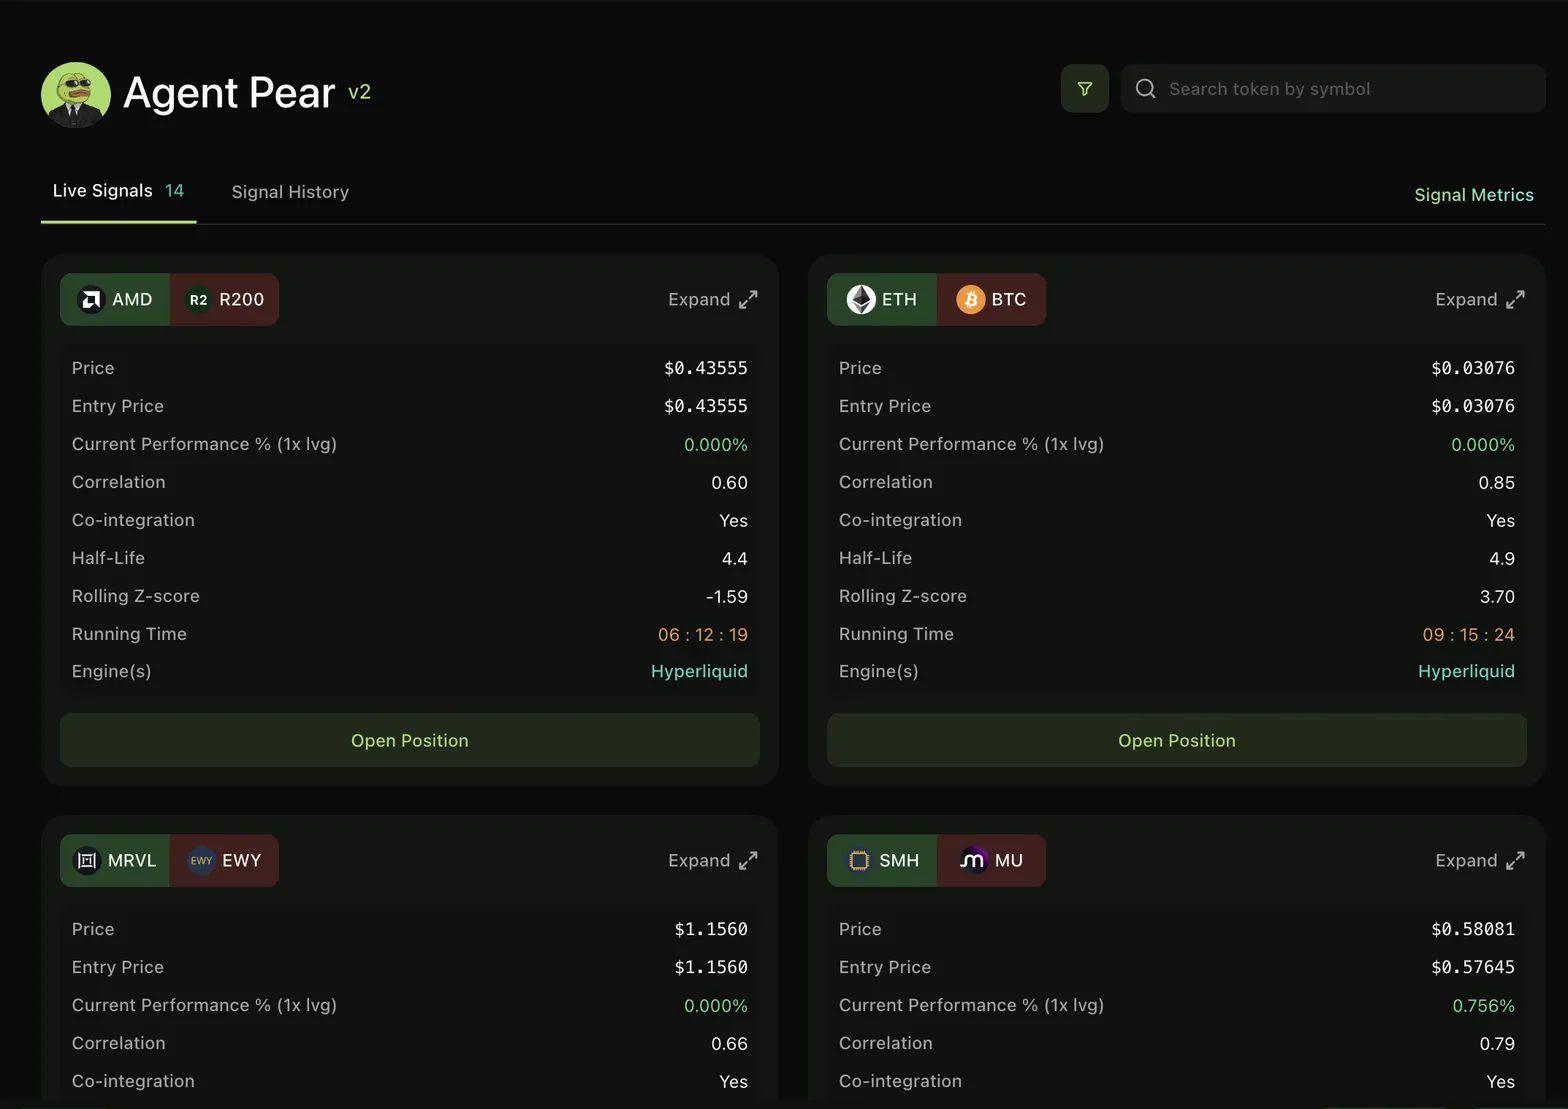
How signals are generated
Statistics run on every closed candle, per timeframe (1H / 4H / 1D), for every eligible same-venue pair:
- Statistics: a Rust service (
pear-stat-rs) computes per-pair: correlation, cointegration, hedge ratio, z-score (static and rolling), half-life, Hurst exponent, volatility, and rebalance beta, across roughly 250,000 eligible pairs (the 1H screen is the largest batch). Statistics are written once per closed candle per timeframe. - Signal generation: a separate service (
pear-stat-arbs) applies the quality gates: the pair must be cointegrated, highly correlated, and mean-reverting (z-score stretched past threshold, reasonable half-life, stable hedge ratio). New signal generation currently runs on the 1H timeframe, so fresh signals arrive on an hourly cadence as each 1H candle closes. There is no sub-second stream. Pairs that pass become candidates; candidates that clear the final gate become active signals. - Delivery: active signals are broadcast over WebSocket and land in the Pear V3 web app signals panel, the assistant's chat surfaces, and notifications.
What a signal contains
Every signal identifies:
- The pair (two assets) and the timeframe it was computed on (1H / 4H / 1D).
- A direction:
LONG_SPREAD(the spread is below its mean: go long the first asset, short the second) orSHORT_SPREAD(spread above its mean: the mirror). - Entry prices for both legs and the hedge ratio (how much of the short leg per unit of long leg).
- The current z-score: how far the spread is from its mean in standard deviations.
Active signals also carry diagnostics: regime classification (is the pair reversion-friendly right now?), beta stability, backtest statistics (win rate, average return, Sharpe, trade count under the same strategy), and lead-lag analytics.
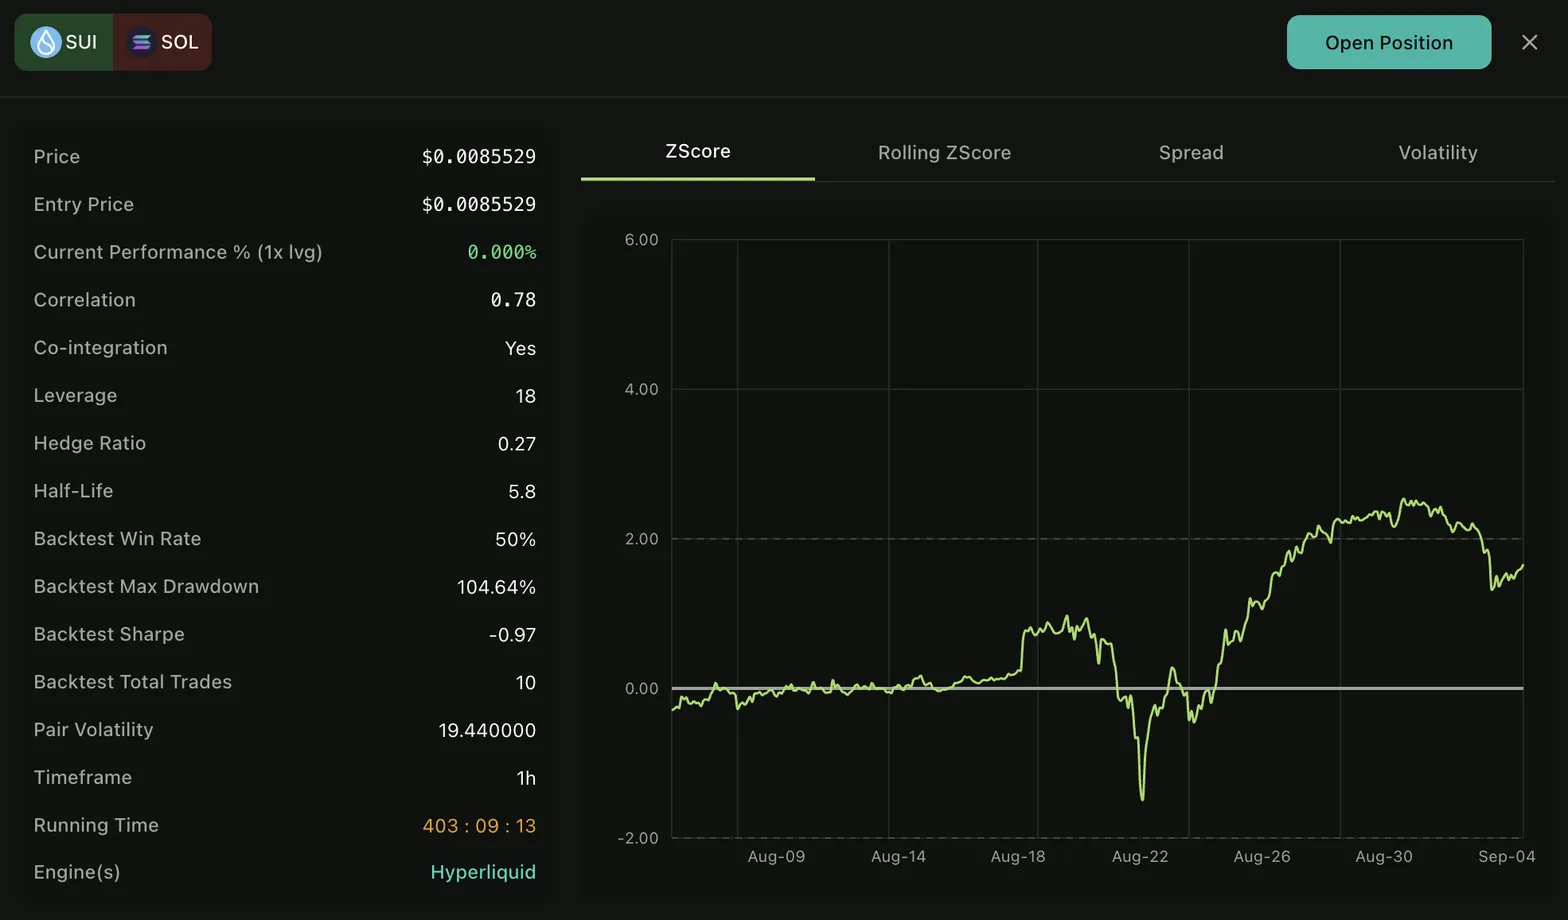
Reading the z-score
| |z| (magnitude) | Meaning |
|---|---|
| ~0 | Spread near its mean: no trade |
| ~1 | Mild deviation: usually not tradable |
| ~2 | Notable deviation: typical entry territory |
| ~3 | Extreme deviation: higher conviction, higher risk the relationship is breaking |
| > 4 | Extraordinary: often a red flag that the pair is no longer cointegrated |
Product convention: enter around |z| ≈ 2, stop if |z| > 4, take profit as |z| returns toward 0.
Using signals
- In the web app, open the Agent Pear signals panel: browse live signals, history, and metrics, then select Open Position on an active signal to load it into a trade ticket, optionally sizing the legs with the signal's beta ratio.
- In chat, ask Agent Pear for today's active signals, candidates, the weekly featured trade, or a pair's full signal history.
- A signal is tradable only on a venue where all its legs are listed, using your linked Hyperliquid or Lighter account.
Pear highlights one high-conviction trade each week as the featured trade.
What signals are not
- Not financial advice: they are statistical setups, not recommendations.
- Not a prediction of direction: they identify stretched spreads that tend to revert; the relationship can break (that's what the >4 band and regime diagnostics flag).
- Not news-driven: social/news pings from Agent Pear are a separate feature (see
/signalsin the AI Trading Assistant) and are explicitly distinct from this quant feed.
For the definitions behind the metrics (correlation, cointegration, rolling z-score, beta, volatility), see Agent Pear Statistics.